This is the beginning of a series contemplating OS concepts discussed in the book Operating Systems: Three Easy Pieces. I recently found out about the tracer ftrace and am planning to use it throughout the series. This post dives into what happens on the kernel side when using the terminal.
Base case
Let’s start with a small ‘hello kernel’ program and follow its execution into the kernel. All codes are run on my test system running kernel version 5.19.7 on x86_64 architecture. For the x86_64 architecture the syscall number is specified in rax and the arguments are passed through rdi, rsi, rdx, etc. If you have the kernel source at hand you can check the calling convention in arch/x86/entry/calling.h
1
2
3
4
5
6
x86 function call convention, 64-bit:
-------------------------------------
 arguments           |  callee-saved      | extra caller-saved | return
[callee-clobbered]   |                    | [callee-clobbered] |
---------------------------------------------------------------------------
rdi rsi rdx rcx r8-9 | rbx rbp [*] r12-15 | r10-11             | rax, rdx [**]
To reduce libc clutter we can compose a bare bones version in assembler that makes only two syscalls write(1) and exit(60) and compile it with gcc -o hello_kernel hello_kernel.s -nostdlib -static.
1
2
3
4
5
6
7
8
9
10
11
12
13
14
.global _start
.intel_syntax noprefix
_start:
  mov rdi, 1
  lea rsi, [rip+output]
  mov rdx, 20
  mov rax, 1
  syscall

  mov rax, 60
  mov rdi, 42
  syscall
output:
  .ascii "hello kernel!\n\0"
When strace’ing the assembly we get the expected two syscalls plus the additional execve that forks the bash process and turns the child into our hello_kernel process.
1
2
3
4
5
PROMPT> strace ./hello_kernel
  execve("./hello_kernel", ["./hello_kernel"], 0x7ffe01ead980 /* 37 vars */) = 0
  write(1, "hello kernel!\n\0\0\0\0\0\0", 20hello kernel!) = 20
  exit(42)                                = ?
  +++ exited with 42 +++
while the inner-workings of each syscall is a black-box in userland, we can follow these calls into the kernel to explore what happens behind the curtain. To explore kernel space we can use the ftrace-wrapper trace-cmd which is readily available in modern Linux kernels. The maintainer Steven Rostedt has amazing youtube videos online where he discusses the magic behind and use cases of ftrace. For the rest of the article mind that PIDs might change as snapshots were taken at different times. Using the wrapper trace-cmd with the appropriate flags we obtain output akin to the strace output above.
1
2
3
4
5
6
7
8
PROMPT> trace-cmd record -e syscalls -F ./hello_kernel
PROMPT> trace-cmd report
  hello_kernel-2308  [007]    91.879017: sys_exit_write:       0x1
  hello_kernel-2308  [007]    91.879025: sys_enter_execve:     filename: 0x7ffc15c37dff, argv: 0x7ffc15c370b0, envp: 0x7ffc15c370c0
  hello_kernel-2308  [009]    91.879885: sys_exit_execve:      0x0
  hello_kernel-2308  [009]    91.879903: sys_enter_write:      fd: 0x00000001, buf: 0x0040102e, count: 0x00000014
  hello_kernel-2308  [009]    91.879919: sys_exit_write:       0x14
  hello_kernel-2308  [009]    91.879921: sys_enter_exit:       error_code: 0x0000002a
The output format follows this structure process_name-PID [#cpu] timestamp_in_s: function arguments/return values. And this is where the fun really begins.
Starting to dig
We can log all events that occur while our program runs, trace-cmd record -p function -e all ./hello_kernel, and display the recorded trace.dat in kernelshark to get an overview of the succession of events. Suppressing events related to idle and trace-cmd, the hello_kernel process appears to wake up the kworker thread which in turn wakes up xfce4-terminal.
 In both hello_kernel and kworker we see the event
 sched_wakeup that seems correlated with the function try_to_wake_up. According to the kernel source this function has the following call signature static int try_to_wake_up(struct task_struct *p, unsigned int state, int wake_flags).
We can plant a kprobe to print data stored in task_struct that describes the process to awake from slumber. According to kernel.org kprobes enable
…you to dynamically break into any kernel routine and collect debugging and performance information non-disruptively. You can trap at almost any kernel code address, specifying a handler routine to be invoked when the breakpoint is hit.
To find the offset that will land us at the pid of the process to wake up we can use pahole.
1
2
3
4
5
6
7
8
9
10
11
12
13
PROMPT> pahole -C task_struct
  struct thread_info         thread_info;          /*     0    24 */
  unsigned int               __state;              /*    24     4 */

  /* XXX 4 bytes hole, try to pack */

  void *                     stack;                /*    32     8 */
  refcount_t                 usage;                /*    40     4 */
  unsigned int               flags;                /*    44     4 */
  unsigned int               ptrace;               /*    48     4 */
  ...
  pid_t                      pid;                  /*  1512     4 */
  ...
We see that the member PID is stored with an offset of 1512 bytes and consists itself of 4 bytes. This allows to set up a kprobe and obtain a trace
1
2
3
4
5
6
7
PROMPT> echo 'p:wake_up_probe try_to_wake_up pid=+1512(%di):s32' > /sys/kernel/tracing/kprobe_events
PROMPT> trace-cmd -e wake_up_probe ./hello_kernel
PROMPT> trace-cmd report
  hello_kernel-9351  [011]    4516.614783: wake_up_probe:        (ffffffff9f0db3f0) pid=7232
  kworker/u24:5-7232  [009]   4516.614798: wake_up_probe:        (ffffffff9f0db3f0) pid=9144
  hello_kernel-9351  [011]    4516.614820: wake_up_probe:        (ffffffff9f0db3f0) pid=9338
  xfce4-terminal-9144  [004]  4516.614854: wake_up_probe:        (ffffffff9f0db3f0) pid=2682
The trace report details how hello_kernel wakes up kworker:7232 with PID 7232 which in turn wakes up our terminal emulator with PID 9144. This nicely coincides with our observation from the kernelshark plot. While this demonstrates how xfce4-terminal wakes up, it raises the question of how our ELF is interacting with the terminal emulator to get the string to be displayed. To this end we can check how tty’s are implemented in Linux.
Linux terminals
While modern terminals (tty) still share some building blocks with predecessors, some rearrangement and separation of processes into kernel and user space has occurred. Using our example program from before the terminal emulator xfce4-terminal that listens to user input is at the master end of a PTY pair that asynchronously transmits any keyboard entries to the PTY slave. When first starting the terminal a shell will be connected to the PTY slave side, here zsh. The child hello_kernel will inherit the PTY slave stdin/stdout/stderr from zsh and can through them write data back to the PTY master.
While both xfce4-terminal and hello_kernel processes live in the userland, the PTY pair is part of the kernel. The following sketch illustrates the flow of text and is adapted from the book The Linux Programming Interface.
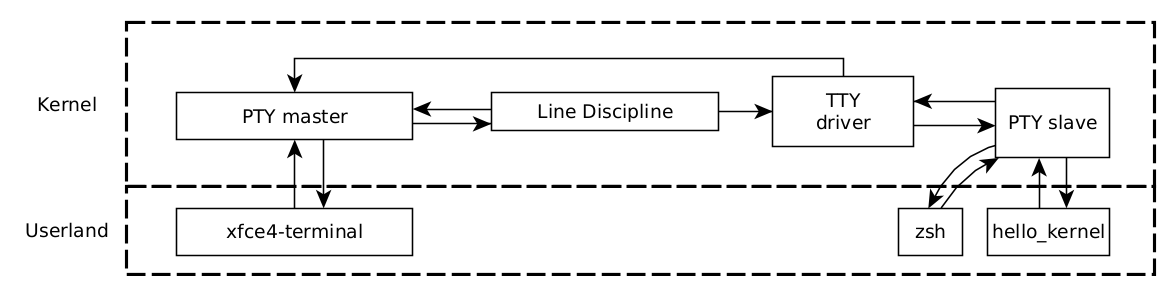 Sandwiched between master and slave are the line discipline and TTY driver. The line discipline only processes the output of the PTY master and not the output of the slave. To such end, the line discipline manages the character buffer, echoes the keystrokes back to the master for display and handles editing commands such as escape codes. Upon pressing
 Enter the buffered characters are copied by the TTY driver to the PTY slave. The line disciplines available on Arch linux can be found in /proc/tty/ldisc and in my case are the default n_tty and raw n_null.
To demonstrate connectedness between both sides of the pipe in our program we can obtain related PIDs through
1
2
3
PROMPT> ps -x --forest | grep 3487
  3461 pts/0    Sl+    0:00      \_ xfce4-terminal
  3487 pts/1    Ss     0:00          \_ zsh
With the PIDs at hand, we can query the file descriptors associated with the xfce4-terminal
1
2
PROMPT> ls -la /proc/3461/fd | grep ptmx
  lrwx------ 1 nop users 64 Sep  5 13:56 10 -> /dev/ptmx
This listing shows a link to the master clone device /dev/ptmx, demonstrating that xfce4-terminal is connected to the master end of a pty-pipe. In the file descriptors of the zsh shell we see that stdin/stdout/stderr are linked to the pseudo-terminal pts1.
1
2
3
4
5
PROMPT> ls -la /proc/3487/fd | grep pts
  lrwx------ 1 nop users 64 Sep  5 13:46 0 -> /dev/pts/1
  lrwx------ 1 nop users 64 Sep  5 14:01 1 -> /dev/pts/1
  lrwx------ 1 nop users 64 Sep  5 14:01 10 -> /dev/pts/1
  lrwx------ 1 nop users 64 Sep  5 14:01 2 -> /dev/pts/1
Running tty in the same zsh would similarly return /dev/pts/1. Since kernel version 2.9.3 tty_struct->index is exposed in the fdinfo record of the ptmx and enables displaying the association between pts and ptmx.
1
2
3
4
5
6
PROMPT> cat /proc/3461/fdinfo/10
  pos:	0
  flags:	0104002
  mnt_id:	24
  ino:	123
  tty-index:	1
We should be able to trace the exchange of messages between xfce and hello_kernel and to proof the master&slave connectedness. We expect our text to ultimately end up in the terminal and hence concentrate on function calls from xfce4-terminal alone for now.
1
2
3
4
5
6
7
8
9
10
11
12
13
14
15
16
17
18
19
20
21
22
23
24
25
26
27
28
29
30
31
32
33
34
35
36
37
38
39
40
41
42
PROMPT> sudo trace-cmd record -p function_graph -g __x64_sys_read ./hello_kernel
PROMPT> sudo trace-cmd report | grep xfce-terminal
  xfce4-terminal-3249  [003]   440.396794: funcgraph_entry:                   |  __x64_sys_read() {
  xfce4-terminal-3249  [003]   440.396794: funcgraph_entry:                   |    ksys_read() {
  xfce4-terminal-3249  [003]   440.396794: funcgraph_entry:                   |      __fdget_pos() {
  xfce4-terminal-3249  [003]   440.396794: funcgraph_entry:                   |        __fget_light() {
  xfce4-terminal-3249  [003]   440.396795: funcgraph_entry:                   |          __rcu_read_lock() {
  xfce4-terminal-3249  [003]   440.396795: funcgraph_exit:         0.130 us   |          }
  xfce4-terminal-3249  [003]   440.396795: funcgraph_entry:                   |          __rcu_read_unlock() {
  xfce4-terminal-3249  [003]   440.396795: funcgraph_exit:         0.129 us   |          }
  xfce4-terminal-3249  [003]   440.396795: funcgraph_exit:         0.630 us   |        }
  xfce4-terminal-3249  [003]   440.396795: funcgraph_exit:         0.876 us   |      }
  xfce4-terminal-3249  [003]   440.396795: funcgraph_entry:                   |      vfs_read() {
  xfce4-terminal-3249  [003]   440.396795: funcgraph_entry:                   |        rw_verify_area() {
  xfce4-terminal-3249  [003]   440.396796: funcgraph_entry:                   |          security_file_permission() {
  xfce4-terminal-3249  [003]   440.396796: funcgraph_entry:                   |            bpf_lsm_file_permission() {
  xfce4-terminal-3249  [003]   440.396796: funcgraph_exit:         0.129 us   |            }
  xfce4-terminal-3249  [003]   440.396796: funcgraph_exit:         0.423 us   |          }
  xfce4-terminal-3249  [003]   440.396796: funcgraph_exit:         0.662 us   |        }
  xfce4-terminal-3249  [003]   440.396796: funcgraph_entry:                   |        new_sync_read() {
  xfce4-terminal-3249  [003]   440.396797: funcgraph_entry:                   |          tty_read() {
  xfce4-terminal-3249  [003]   440.396797: funcgraph_entry:                   |            tty_paranoia_check() {
  xfce4-terminal-3249  [003]   440.396797: funcgraph_exit:         0.128 us   |            }
  xfce4-terminal-3249  [003]   440.396797: funcgraph_entry:                   |            tty_ldisc_ref_wait() {
  xfce4-terminal-3249  [003]   440.396797: funcgraph_entry:                   |              ldsem_down_read() {
  xfce4-terminal-3249  [003]   440.396797: funcgraph_exit:         0.139 us   |              }
  xfce4-terminal-3249  [003]   440.396797: funcgraph_exit:         0.398 us   |            }
  xfce4-terminal-3249  [003]   440.396798: funcgraph_entry:                   |            n_tty_read() {
  xfce4-terminal-3249  [003]   440.396798: funcgraph_entry:                   |              __tty_check_change() {
  xfce4-terminal-3249  [003]   440.396798: funcgraph_exit:         0.259 us   |              }
  xfce4-terminal-3249  [003]   440.396798: funcgraph_entry:                   |              mutex_trylock() {
  xfce4-terminal-3249  [003]   440.396798: funcgraph_exit:         0.208 us   |              }
  xfce4-terminal-3249  [003]   440.396799: funcgraph_entry:                   |              down_read() {
  xfce4-terminal-3249  [003]   440.396799: funcgraph_exit:         0.172 us   |              }
  xfce4-terminal-3249  [003]   440.396799: funcgraph_entry:                   |              add_wait_queue() {
  xfce4-terminal-3249  [003]   440.396799: funcgraph_entry:                   |                _raw_spin_lock_irqsave() {
  xfce4-terminal-3249  [003]   440.396799: funcgraph_exit:         0.131 us   |                }
  xfce4-terminal-3249  [003]   440.396799: funcgraph_entry:                   |                _raw_spin_unlock_irqrestore() {
  xfce4-terminal-3249  [003]   440.396799: funcgraph_exit:         0.136 us   |                }
  xfce4-terminal-3249  [003]   440.396800: funcgraph_exit:         0.654 us   |              }
  xfce4-terminal-3249  [003]   440.396800: funcgraph_entry:                   |              copy_from_read_buf() {
  xfce4-terminal-3249  [003]   440.396800: funcgraph_entry:                   |                tty_audit_add_data() {
The syscall x64_sys_read() initiates several interesting function calls such as n_tty_read(), copy_from_read_buf() and tty_audit_add_data(). The kernel source reveals the call signature of n_tty_read(): n_tty_read(struct tty_struct *tty, struct file *file, unsigned char *kbuf, size_t nr, void **cookie, unsigned long offset). We previously saw that tty_struct gives us access to tty_struct->index and
digging into the members of tty_struct we can find tty_struct->driver->subtype that identifies which side of the pipe the process is on with the following encoding stated in include/linux/tty_driver.h.
1
2
3
/* pty subtypes (magic, used by tty_io.c) */
#define PTY_TYPE_MASTER                 0x0001
#define PTY_TYPE_SLAVE                  0x0002
We can use pahole again to find the offsets of the struct members. At tty_struct offset 496 we find a pointer to the tty_struct from the other end of the PTY pair which we expect to have the opposite subtype value. Unlike xfce4-terminal we expect a n_tty_write for the process hello_kernel. n_tty_write has a pointer to a tty_struct as its first argument also. For what is worth we can use stack traces to get a sequence of function calls prior to a function of interest. E.g. for n_tty_write we get the listing
1
2
3
4
5
6
7
8
9
10
11
PROMPT> trace-cmd record -p function -l n_tty_write --func-stack ./hello_kernel
PROMPT> trace-cmd report
  hello_kernel-16635 [007] 11482.303964: function:             n_tty_write <-- file_tty_write.constprop.0
  hello_kernel-16635 [007] 11482.303982: kernel_stack:         	=> ftrace_trampoline
    => n_tty_write
    => file_tty_write.constprop.0
    => new_sync_write
    => vfs_write
    => ksys_write
    => do_syscall_64
    => entry_SYSCALL_64_after_hwframe
The -l option is the same as echoing its argument into /sys/kernel/tracing/set_ftrace_filter when running ftrace without the trace-cmd wrapper
Using the information obtained we are ready to set up two kprobes hooking into n_tty_write() and n_tty_read().
1
2
3
4
5
6
PROMPT> echo 'p:n_tty_write_probe n_tty_write buf=+0(%dx):string subtype=+58(+16(%di)):s16 index=+32(%di):s32 linked_subtype=+58(+16(+496(%di))):s16' > /sys/kernel/tracing/kprobe_events
PROMPT> echo 'p:n_tty_read_probe n_tty_read buf=+0(%dx):string subtype=+58(+16(%di)):s16 index=+32(%di):s32 linked_subtype=+58(+16(+496(%di))):s16' >> /sys/kernel/tracing/kprobe_events
PROMPT> trace-cmd record -e n_tty_write_probe -e n_tty_read_probe ./hello_kernel
PROMPT> trace-cmd report
  hello_kernel-8002    [010] 12379.725560: n_tty_write_probe:    (ffffffff9b31b224) buf="hello kernel!" subtype=2 index=3 linked_subtype=1
  xfce4-terminal-3249  [007] 12379.725587: n_tty_read_probe:     (ffffffff9b31c1d4) buf="" subtype=1 index=3 linked_subtype=2
We see again that hello_kernel is connected to PTY slave (subtype=2), while xfce4-terminal occupies the PTY master (subtype=1), their associated slave pty is /dev/pts/3 (index=3). Both linked subtypes correspond to the other side of the pipe and replaces the subtype 1 with 2 and vice versa. I included the buf as an extra. In the case of hello_kernel it contains the string we are trying to print to the screen.
So the flow of events appear to be that hello_kernel writes the output string with n_tty_write to a buffer, queues up work, wakes up kworker which in turn wakes up xfce4-terminal to write the string to the terminal.
Conclusion
It was a great experience to experiment with ftrace and follow along in the Linux kernel. Ftrace seems a great tool to investigate the scheduling process and memory management in the future.
Resources
Steven Rostedt - Learning the Linux Kernel with tracing
Alex Dzyoba - Ftrace
Linus Akesson - The TTY demystified